

TL;DR:
- Controllable operational factors such as presentation, maintenance responsiveness, and pricing determine rental property outperformance within the same area. Consistent, proactive management that focuses on tenant-fit and quick issue resolution significantly reduces vacancy and turnover costs. Treating rental properties as operating businesses, rather than passive assets, leads to higher occupancy, better tenant retention, and improved income stability.
Rental property outperformance is defined by a set of controllable operational factors, not by postcode alone. Two properties on the same street, priced within a similar range, can produce vastly different occupancy rates and net operating income depending on how they are presented, maintained, priced, and managed. Understanding why some rental properties outperform others in the same area requires looking beyond geography and into the decisions owners make every day. The gap between a high-performing property and a struggling one is almost always a gap in execution.
Why rental properties vary even within the same street
Presentation and operational quality are the primary drivers separating high-performing rentals from those that sit vacant. Properties with outdated interiors, slow maintenance responses, unrealistic pricing, and weak marketing are eliminated from a prospective tenant’s shortlist before a viewing is ever booked. This means the performance gap opens at the very first moment of contact, not at the point of negotiation.

Tenants in 2026 make decisions quickly. They compare listings side by side, and properties that fail on photography, cleanliness, or layout fit are discarded within seconds. The rental property performance factors that matter most are the ones visible before a tenant ever steps through the door. Micro-location within a neighbourhood, the quality of the listing presentation, and the responsiveness of the operator all shape whether a property attracts the right tenant at the right price.
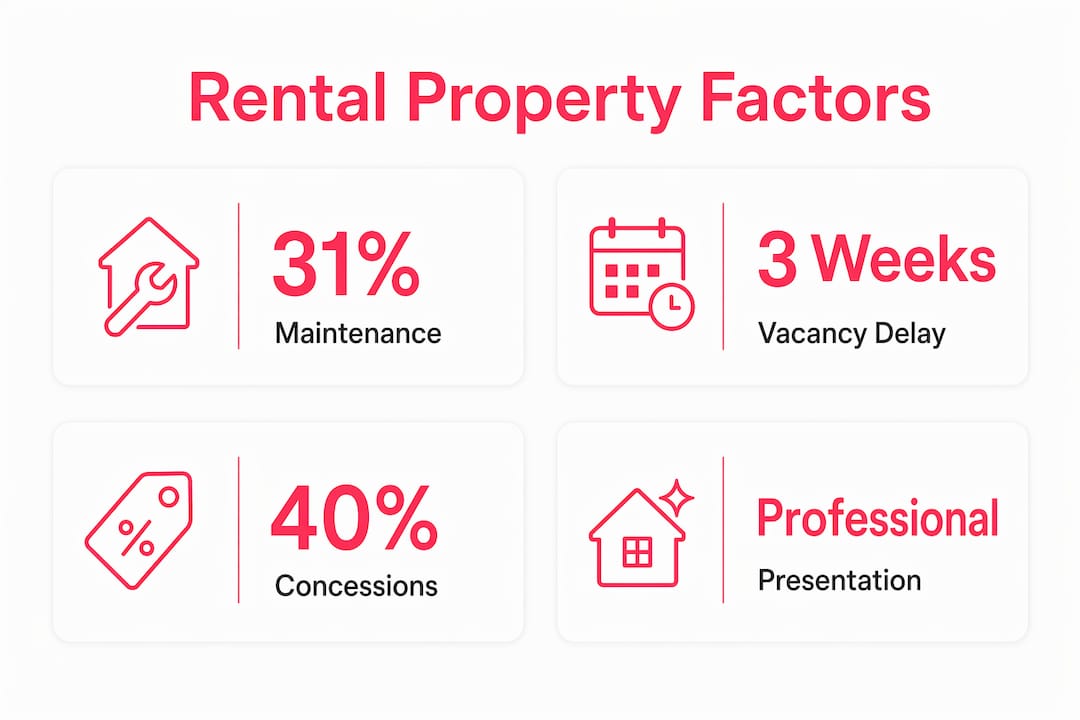
The financial consequences compound over time. A property that takes three extra weeks to lease each cycle loses income that cannot be recovered. A tenant who leaves after twelve months because of poor maintenance costs the owner far more than the repair that was delayed. These are not abstract risks. They are predictable outcomes of predictable decisions.
What operational and maintenance factors affect tenant attraction and retention?
Maintenance responsiveness is one of the most direct levers an owner controls, and one of the most frequently underestimated. 31% of tenants cite maintenance as their primary reason for leaving a property. Slow repairs, defined as those taking longer than 24 to 48 hours to resolve, increase churn risk significantly. That is not a minor inconvenience metric. It is a retention crisis waiting to happen.
The distinction between predictive maintenance and break-fix maintenance is where professional operators separate themselves from casual landlords. Break-fix management responds to problems after they occur. Predictive management schedules inspections, replaces ageing components before they fail, and communicates proactively with tenants. About 40% of uncertain tenants would choose to stay if maintenance quality and communication improved. That figure represents a substantial retention opportunity that costs far less than sourcing a replacement tenant.
Operational execution during tenant turnover also carries a direct financial cost. Every day a property sits vacant between tenancies is a day of lost income. Cleaning, minor repairs, repainting, and relisting all take time, and the speed at which these are completed determines how quickly the next lease begins. Inadequate management and maintenance account for approximately 24% of building damage, which translates into higher repair costs and a deteriorating asset over time.
Pro Tip: Set a written service level agreement for maintenance response: acknowledge within four hours, resolve within 48. Tenants who receive this standard rarely cite maintenance as a reason to leave.
Key operational factors that directly influence tenant retention include:
- First-fix resolution rate: resolving issues on the first visit prevents escalation and signals competence
- Communication speed: acknowledging a request within hours reduces frustration even before the repair is complete
- Scheduled property inspections: identifying wear before it becomes damage protects both the asset and the relationship
- Turnover speed: a well-organised turn process reduces vacancy days and maintains income continuity
- Appliance and fixture quality: reliable, modern appliances reduce call-out frequency and improve tenant satisfaction
How does professional presentation and tenant-fit influence rental success?
Professional presentation determines whether a property reaches a tenant’s shortlist at all. High-quality photography, natural lighting, fresh paint, clean surfaces, and well-maintained outdoor spaces are not optional extras. They are the minimum standard for a property competing in any market where tenants have choice. Tenant segment targeting and layout desirability directly influence rental speed and retention, and properties with atypical layouts, such as tri-level configurations or awkward stair placements, are consistently harder to let.
Layout alignment with tenant lifestyle is a factor many owners overlook entirely. A family seeking a single-storey home will not consider a split-level property regardless of its other merits. A professional requiring a home office will eliminate any property without a suitable dedicated space. Tenants do not adapt their needs to fit a property. They eliminate properties that do not fit their needs. This process happens fast, and properties that fail the layout test never recover that opportunity.
The following table illustrates how presentation choices affect tenant perception and leasing outcomes:
| Presentation factor | Lower standard | Higher standard |
|---|---|---|
| Photography | Dim, cluttered, phone camera | Professional, well-lit, staged |
| Laitteet | Mixed ages, white goods only | Stainless steel, modern, matching |
| Paintwork | Scuffed, dated colours | Fresh neutral tones throughout |
| Ulkotila | Overgrown or neglected | Tidy, maintained, inviting |
| Furnishing quality | Mismatched or worn | Consistent, clean, fit for purpose |
Furnishing quality and appliance choices carry more weight than owners typically expect. Stainless steel appliances, non-electric hobs, and consistent furniture styles signal that a property has been prepared with care. Tenants who perceive this level of attention are more likely to treat the property with corresponding respect, which reduces wear and supports longer tenancies.
Pro Tip: Walk through your property as a prospective tenant would. Photograph every room from the doorway. If the image would not make you want to book a viewing, it will not make a tenant want to either.
Why accurate pricing and competitive concessions matter within the same neighbourhood
Pricing accuracy within a local market is not a passive exercise. Local market rent variations can span hundreds of pounds within the same city block, and relying on stale or wide-radius comparables leads directly to mispricing. A property priced above its true market position sits vacant. A property priced below it loses income that compounds across every lease cycle.
The use of concessions has become a significant competitive variable. Nearly 40% of rental listings now offer concessions such as free rent periods or waived fees, and concessions reached a record average of £129 per unit in Q1 2026. This matters because face rent and effective rent are no longer the same figure. A property advertised at £2,000 per month with one month free on a twelve-month lease has an effective rent of approximately £1,833. Evaluating and comparing properties on face rent alone produces misleading conclusions.
The strategic use of concessions is concentrated in supply-heavy markets where occupancy pressure is highest. For owners, the decision to offer a concession should be weighed against the cost of extended vacancy. A two-week void period on a £2,000 per month property costs approximately £1,000 in lost income. A one-week rent-free concession to secure a strong tenant immediately may be the more profitable choice.
Pricing decisions also function as a tenant selection tool. A property priced accurately for its condition and location attracts tenants who can genuinely afford it. Overpriced properties that eventually reduce attract tenants who were previously priced out, which may not align with the tenant profile the owner was seeking. Reviewing local comparable analysis monthly, rather than annually, keeps pricing aligned with actual market conditions.
How do micro-location and tenant experience impact rental performance?
Micro-location is the precise position of a property within a neighbourhood, and it carries more weight than the neighbourhood name alone. A flat on a quiet residential street performs differently from an identical flat on a busy arterial road two hundred metres away. Proximity to transport links, schools, supermarkets, and green spaces shapes tenant demand in ways that a postcode cannot capture.
Tenant lifestyle priorities in 2026 centre on convenience, safety, and connectedness. Properties that offer walkable access to daily amenities, reliable public transport, and a sense of community attract and retain tenants more effectively than those that require a car for every errand. Similar properties differ in performance based on street placement and immediate surroundings, even when the headline location appears identical.
The quality of neighbouring properties and the character of the immediate street also influence tenant retention. A well-maintained property surrounded by neglected ones creates a perception mismatch that tenants notice. Conversely, a property in a well-kept street benefits from the collective standard of its surroundings. This is not something an owner can control directly, but it is a factor worth assessing before acquisition and when evaluating rental potential for an existing asset.
Micro-location factors that influence tenant demand include:
- Distance to public transport: properties within a ten-minute walk of a station or frequent bus route command stronger demand
- Proximity to employment centres: particularly relevant for professional and corporate tenant segments
- Street character: noise levels, traffic volume, and the condition of neighbouring properties
- Access to green space: parks and open areas are increasingly prioritised by tenants with families or remote working arrangements
- Safety perception: well-lit streets, low anti-social behaviour, and active community presence
What are the financial impacts of vacancy and turnover on rental profitability?
Vacancy and turnover costs are the most direct financial expression of every operational decision an owner makes. A 5% vacancy rate equates to approximately 18 lost days per year. At 10%, that rises to 36 days. On a property generating £2,000 per month, a 10% vacancy rate costs £2,400 annually in lost rent before any turnover expenses are counted.
Turnover costs compound the vacancy loss. The total cost per unit turnover ranges from approximately £1,700 to £4,200 when cleaning, repairs, marketing, and administration are included. In a portfolio of 40 units with 50% annual turnover, these costs can reach £50,000 to £60,000 per year. That figure represents a direct reduction in net operating income (NOI) that no pricing strategy can fully offset.
The financial case for reducing turnover is clear:
- Retain one additional tenant per year and save the full cost of one turnover cycle, typically £1,700 to £4,200
- Reduce vacancy by one week per tenancy and recover approximately £500 on a £2,000 per month property
- Resolve maintenance issues on first contact and reduce the probability of early lease termination
- Price accurately from day one and avoid the compounding cost of extended vacancy during a price correction
- Invest in presentation before listing and reduce the average days-to-let, improving annual income across every cycle
Reducing turnover rate directly improves NOI, and even one to two weeks faster lease-up per cycle produces a measurable improvement in annual returns. These are not marginal gains. Across a portfolio, they represent the difference between a property that performs and one that merely exists.
Key takeaways
Rental property outperformance within the same area is determined by controllable factors: presentation quality, maintenance responsiveness, accurate pricing, micro-location awareness, and operational discipline applied consistently across every tenancy cycle.
| Kohta | Yksityiskohdat |
|---|---|
| Maintenance drives retention | 31% of tenants leave due to maintenance issues; proactive management reduces this risk significantly. |
| Presentation determines shortlisting | Professional photography, fresh interiors, and layout alignment decide whether a property is viewed at all. |
| Pricing accuracy prevents vacancy | Stale comparables and face rent reliance lead to mispricing; effective rent is the correct metric. |
| Micro-location shapes demand | Street placement, transport access, and neighbourhood character influence tenant decisions beyond postcode. |
| Turnover costs compound losses | Each tenancy change costs £1,700 to £4,200; reducing turnover rate directly improves net operating income. |
What I have learned about properties that consistently outperform
Having worked closely with property owners across Sweden and the Nordics, the pattern I see most often is this: the owners whose properties outperform are not necessarily the ones with the best locations. They are the ones who treat their properties as operating businesses rather than passive assets.
The conventional view is that location determines everything. My experience suggests otherwise. I have seen well-located properties underperform consistently because the owner responds to maintenance requests slowly, prices on instinct rather than data, and photographs the property on a grey afternoon with a phone. I have also seen modestly located properties achieve near-full occupancy year-round because the operator treats every tenant interaction as a retention opportunity.
What I find undervalued most often is professional presentation at the point of listing. Owners invest in the property itself but underinvest in how it is shown to the world. A property that looks exceptional in its listing photographs attracts more enquiries, commands stronger negotiating position, and tends to attract tenants who value quality. That correlation is not accidental.
The other insight I would offer is this: tenant-fit matters more than tenant volume. A property that attracts the right tenant quickly, one who stays for two or three years and treats the property with care, outperforms a property that cycles through tenants annually even if the face rent is slightly higher. The financial arithmetic of retention is compelling. The operational calm it produces is equally valuable.
For owners considering how to improve property management standards, the starting point is almost always the same: audit what your property looks like from the outside, how quickly you respond when something goes wrong, and whether your pricing reflects what the market will actually pay today.
— Joakim
How Guestlyhomes supports owners in maximising rental performance

Guestlyhomes operates fully managed, high-standard properties across Sweden and the Nordics, applying the same operational principles this article describes: professional presentation, proactive maintenance, accurate pricing, and a consistent tenant experience from first contact to final day. Every property in the Guestlyhomes portfolio is prepared and managed to a 5-star standard, which is why occupancy rates and guest satisfaction consistently outperform the local market average. If you own a premium property and want to understand what professional operation looks like in practice, explore the business villa or the lake view villa as examples of what Guestlyhomes delivers for owners and guests alike.
FAQ
Why do two similar properties in the same area perform differently?
Performance differences arise from controllable factors including presentation quality, maintenance responsiveness, pricing accuracy, and tenant-fit. Properties that fail on any of these criteria are eliminated from a tenant’s shortlist before a viewing is booked.
How much does tenant turnover actually cost a landlord?
The total cost per tenancy change ranges from approximately £1,700 to £4,200, covering lost rent, cleaning, repairs, and administration. In a portfolio with high annual turnover, these costs can reach £50,000 to £60,000 per year.
What is effective rent and why does it matter?
Effective rent is the actual income received after accounting for concessions such as free rent periods or waived fees. With nearly 40% of listings now offering concessions, comparing properties on face rent alone produces misleading performance assessments.
How does micro-location differ from general location?
Micro-location refers to a property’s precise position within a neighbourhood, including proximity to transport, noise levels, street character, and neighbouring property quality. Two properties in the same postcode can have meaningfully different demand profiles based on these factors.
What maintenance standard reduces tenant churn most effectively?
Acknowledging maintenance requests within four hours and resolving them within 48 hours is the operational standard that most directly reduces churn risk. Research shows that approximately 40% of tenants who are uncertain about renewing would stay if maintenance quality and communication improved.